
Most investors spent 2025 watching gold break record after record. Meanwhile, a quieter story was unfolding right beside it — one that delivered nearly twice the returns.
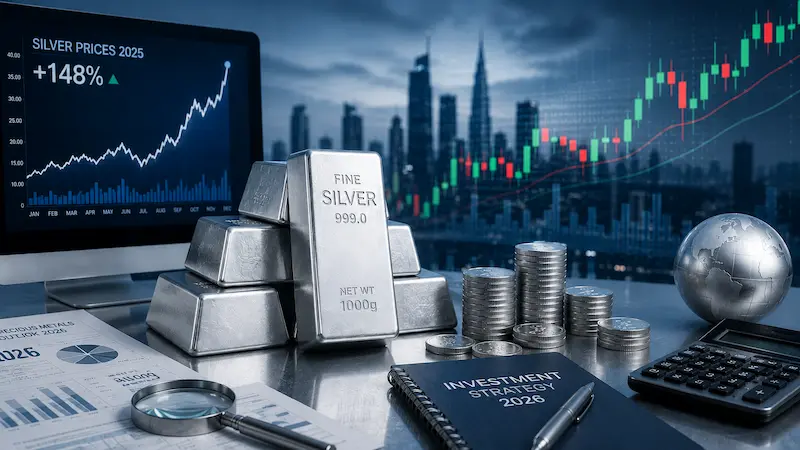
Silver gained 148% in 2025. Gold gained around 64% in the same period. It was not even close.
Silver's move was so large and so fast that it shook the markets. COMEX exchange margins were raised — something that has only happened twice before in silver's modern history, in 1980 and 2011. Physical bars disappeared from dealers. Premiums on silver coins jumped. And on January 29, 2026, silver hit its all-time nominal high of $121.67 per ounce — a price level that existed only in the imagination of the most bullish analysts just 18 months earlier.
Then it pulled back. As of mid-2026, silver is trading around $65 per ounce — still historically elevated, but well off the January peak. And that pullback has opened a question that many investors are now seriously asking: Is silver still the best investment opportunity of 2026?
This article gives you the honest, data-driven answer — covering where silver stands today, the five structural forces driving it, what the major banks are forecasting, the real risks you need to understand, and how silver compares to gold in the current market.
1. Silver Price 2025 and 2026 — The Direct Answer
Silver gained 148 percent in 2025 — its best annual return since 1979 — driven by six consecutive years of structural supply deficit, explosive industrial demand from solar and EVs, and a precious metals bull market. Silver hit an all-time high of $121.67 per ounce on January 29, 2026 before correcting to approximately $65 by mid-year. JPMorgan forecasts a full-year 2026 average of $81/oz, with Bank of America's bull case ranging up to $135–$309/oz.
2. What Happened to Silver in 2025 — The Full Story
To understand where silver is going, you need to understand what drove it here.
Silver began 2025 around $29–$32 per ounce — elevated by historical standards, but unspectacular. By year-end, it closed above $67. In less than twelve months, it had more than doubled. The 2025 return was the best performance for silver since 1979 — the year of the Hunt Brothers' attempt to corner the silver market.
Unlike the Hunt Brothers episode, however, the 2025 rally was not driven by a single actor trying to manipulate the market. It was driven by a convergence of genuine structural forces that had been building for years:
- Six consecutive years of supply deficits — the global silver market has produced less silver than it consumes every year since 2021, draining above-ground stockpiles
- Explosive industrial demand from solar, electric vehicles, 5G, and AI data centres — all of which require silver and cannot easily substitute it
- Tariff uncertainty — US trade policy triggered a scramble to move physical silver from London and Asia into American vaults, creating acute regional shortages and sending lease rates temporarily 30 times above normal
- Investment demand returning — after years of net ETF outflows, Western investors came back to silver in 2025, creating a demand surge on top of already tight physical supply
- Gold's bull market lifting silver — gold's 64% gain in 2025 eventually pulled silver higher, as it always does in precious metals bull markets, but with far greater percentage force
The result was a move that stunned even the most bullish silver analysts. And the structural forces behind it have not gone away.
3. Silver's Current Position — Where Silver Stands in Mid-2026
After hitting $121.67 in late January 2026, silver corrected sharply. As of June 2026, silver is trading around $65 per ounce on COMEX — down roughly 46% from the peak, but still:
- More than double where it started 2025
- The sixth consecutive year of structural supply deficit continues
- JPMorgan forecasts a full-year 2026 average of $81 per ounce — implying significant recovery from current levels
- The gold-silver ratio sits around 65:1, below its recent historic highs but still suggesting room for silver to outperform
The correction from $121 to $65 is large and looks alarming in isolation. In context, it is a normal consolidation within a structural bull market. Gold dropped over 25% from its January 2026 peak within weeks and still has major banks forecasting $5,400–$6,300 by year-end. Silver's correction is proportionally similar.
You can track the live XAG/USD silver spot price updated in real time at FloatForex's gold and silver charts — alongside gold prices and the gold-silver ratio.
4. The Five Structural Forces Behind Silver's Story
Force 1 — Six Consecutive Years of Supply Deficit
This is the most important fact about silver that most people do not know: the world has been consuming more silver than it produces every single year since 2021.
According to the Silver Institute's latest World Silver Survey, the global silver market will record a shortfall of 46.3 million ounces in 2026 — widening from 40.3 million ounces in 2025. This is the sixth consecutive annual deficit.
To put that in perspective: six years of running deficits means six years of drawing down the world's above-ground silver stockpiles. COMEX inventories — the physical silver held in exchange-registered vaults — have fallen over 70% since 2020. That silver has not been produced. It has been consumed. And mine supply cannot respond quickly. Approximately 70% of silver is produced as a byproduct of mining other metals — copper, zinc, lead. When you want more silver, you cannot simply build a silver mine. You have to wait for more base metal mines to come online, and that takes years.
A market in structural deficit for six consecutive years — with shrinking stockpiles and limited ability to increase supply — has a mathematical floor under prices that purely financial assets simply do not have.
Force 2 — The Green Energy Revolution Needs Silver
This is where silver's story gets genuinely exciting — and where it diverges fundamentally from gold.
Gold is primarily a monetary metal. Central banks buy it, investors hoard it, jewellers use it. Industrial demand for gold is a small fraction of total consumption. Silver is completely different. Industrial applications now account for over 50% of total silver demand — and that percentage is growing.
The single largest industrial consumer of silver is the solar energy sector. Every solar panel contains silver paste for electrical conductivity — silver is the best conductor of electricity on earth, and no cheaper substitute exists at the scale solar requires. Solar photovoltaic installations globally consume over 200 million ounces of silver per year — roughly one-fifth of the entire global mine supply — and that number has grown dramatically as solar capacity has expanded.
The electric vehicle revolution adds another demand layer. EVs require 67–79% more silver than traditional combustion engine vehicles, with approximately 25–50 grams of silver per electric vehicle used in battery management systems, power electronics, charging infrastructure, and electrical contacts. By 2031, EVs are forecast to account for 59% of automotive silver demand — a massive structural shift that creates decades of growing demand.
AI data centres are the newest major demand driver. Global IT power capacity increased approximately 53 times between 2000 and 2025. Every server, every connection, every high-efficiency computing component in an AI data centre requires silver. The AI chip market is expected to grow at a compound annual growth rate of 38% through 2033. Each percentage of that growth represents more silver consumed — permanently, since unlike gold, silver used in industrial applications is rarely recycled.
5G infrastructure adds yet another layer. Every 5G base station, every connected IoT device, requires silver for its superior electrical conductivity. As 5G rollout continues globally and the number of connected devices multiplies, this demand stream compounds independently of investment flows.
Force 3 — Silver Is Both a Precious Metal and an Industrial Metal
This dual nature is silver's defining characteristic — and what makes it different from any other commodity.
During periods of financial uncertainty, silver benefits from safe-haven buying alongside gold. During periods of economic expansion, silver benefits from industrial demand growth. In theory, it should always have at least one tailwind. In practice, the two demand drivers do not always move together — which creates complexity and volatility. But in 2025–2026, both drivers are active simultaneously: geopolitical uncertainty is driving safe-haven demand while the green energy transition drives industrial demand. This convergence is exactly the environment where silver historically performs best.
The Silver Institute confirms: "Investment demand is rising. Global physical investment is forecast to increase about 20% to 227 million ounces — reaching a three-year high. Western investors are returning after several weak years, supported by strong prices and economic uncertainty."
Force 4 — The Gold-Silver Ratio Suggests Silver Remains Undervalued Relative to Gold
The gold-silver ratio measures how many ounces of silver it takes to buy one ounce of gold. Historically, this ratio has averaged between 60:1 and 75:1 over long periods. When it rises significantly above 80:1, it has historically indicated that silver is cheap relative to gold — and subsequent periods have tended to see silver outperform gold as the ratio normalises.
In recent years, the ratio climbed above 80:1, signalling that silver was historically inexpensive relative to gold. Silver's 2025 rally compressed the ratio significantly — but as of mid-2026, the ratio sits around 65:1, still within the range that has historically preceded further silver outperformance.
In previous precious metals bull markets, silver has consistently outperformed gold on a percentage basis in the later stages of the rally. In 2025, gold gained 64% and silver gained 148% — a near-perfect illustration of this pattern. If the broader precious metals bull market continues through 2026, the historical precedent strongly suggests silver will again deliver higher percentage returns than gold, even from current levels.
Force 5 — A Weak Dollar and Federal Reserve Rate Cuts
Silver, like gold, has a well-established inverse relationship with the US Dollar. When the dollar weakens — as it has during the Fed's easing cycle — silver priced in dollars typically rises. ING analysts note that "gold's main drivers, including central bank buying, Fed rate cuts, a weaker dollar, and ETF buying, are all still in place" — and every one of these drivers applies equally or more powerfully to silver.
Lower US interest rates reduce the opportunity cost of holding silver, which pays no interest. A weaker dollar boosts silver's attractiveness to international buyers — particularly in Asia, where India and China together represent some of the world's largest silver markets. The Fed's rate-cutting trajectory, if it continues through 2026, provides a consistent macro tailwind for silver prices.
5. Silver Price Forecast 2026 — What the Major Banks Are Saying
| Institution / Source | Silver Price Target / Forecast | Timeframe |
|---|---|---|
| JPMorgan | $81/oz average | Full year 2026 |
| Bank of America | $135–$309/oz | 2026 upside scenario |
| Dukascopy | $100–$135 base case | 2026 year-end |
| FX Empire | $100 as next major target | H2 2026 |
| LongForecast | $62.80–$90.11 range | 2026 full year |
| Silver Institute | Sixth consecutive deficit year | 2026 |
| Reuters analysts median | Mid-to-high $70s | Late 2026 |
| Capital Economics (bear) | $35–$40 | If gold bull market ends |
JPMorgan's $81 average forecast — "more than double its average in 2025" — is the most cited institutional target. Bank of America's $135–$309 range is the most extraordinary mainstream forecast ever published for silver, built on historical gold-to-silver ratio compression analysis by analyst Michael Widmer. Even if Bank of America's upper range is treated as fantasy, the lower end ($135) represents roughly 100% upside from current levels of around $65.
The range of forecasts is enormous — from $35 (bear case, if the precious metals bull market ends) to $309 (bull case, ratio compression). This wide dispersion reflects silver's genuine uncertainty. It is not a predictable, slow-moving asset. It is one of the most volatile commodities on earth.
6. The Risks — What Could Stop Silver's Rally
Being honest about silver means being honest about its risks. There are real headwinds in 2026 that every investor should understand before buying.
Risk 1 — Solar Thrifting and Substitution
The largest industrial consumer of silver — the solar sector — is actively working to use less of it. High silver prices create powerful economic incentives to reduce silver content per panel or replace it with cheaper alternatives. The Silver Institute reports that solar demand from photovoltaic installations is expected to fall 19% in 2026, even as global solar capacity expands by around 15%. This is "thrifting" — manufacturers reformulating processes to use less silver per unit. If thrifting accelerates, it reduces one of the key structural demand drivers.
Risk 2 — Extreme Volatility
Silver dropped from $121 to $65 in weeks. That is a 46% correction. This level of volatility is not unusual for silver — it has happened before and will happen again. Silver is a thin market relative to gold. Large institutional trades, margin calls, or sudden shifts in sentiment can move the price by 10–15% in a single session. Investors who cannot tolerate this volatility — psychologically or financially — should be cautious.
Risk 3 — If Gold's Bull Market Ends, Silver Falls Harder
Silver's precious metal demand — safe-haven buying, investment flows, ETF demand — depends heavily on gold's direction. If gold's bull market ends (for example, if the Fed unexpectedly turns hawkish and the dollar surges), silver typically falls faster and further than gold. The same leverage that makes silver outperform gold in a bull market makes it underperform gold in a bear market. Capital Economics' bear case of $35–$40 is explicitly built on this scenario.
Risk 4 — China Solar Policy Changes
China installs more solar capacity than any other country and is the dominant driver of global solar silver demand. Policy adjustments in China — such as reductions in solar subsidies, changes to installation targets, or the acceleration of silver-free solar cell technologies — could reduce silver demand from this sector faster than other industrial segments can compensate.
Risk 5 — Physical Market Complexity
Silver's physical market is more complex than gold's. Regional dislocations — where silver is abundant in one market but scarce in another — can create price distortions that do not reflect underlying supply-demand fundamentals. The 2025 tariff-driven scramble to move silver into American vaults created artificial tightness that helped push the price to $121. When that distortion resolved, prices corrected sharply. Investors need to distinguish between structural supply issues and temporary market dislocations.
7. Silver vs Gold in 2026 — Which Is the Better Investment?
This is the question every precious metals investor is asking right now. Here is the honest answer.
| Factor | Gold | Silver |
|---|---|---|
| 2025 return | ~64% | ~148% |
| Current price vs ATH | ~20% below Jan 2026 high | ~46% below Jan 2026 high |
| Industrial demand | Small (~10% of total demand) | Large (~50%+ of demand) |
| Central bank buying | 800+ tonnes/year — massive | Not a factor |
| Supply deficit | Mild — recycling covers most needs | Sixth consecutive year of deficit |
| Volatility | Moderate | Very high |
| Bull market leverage | Base return | Historically 2–3x gold's % return |
| Bear market risk | Cushioned by central bank buying | Falls harder and faster than gold |
| Best for | Stability, portfolio protection, long-term store of value | Higher-risk, higher-reward play on precious metals bull market |
The answer is not one or the other — it depends on your investment profile. If you want stability and a proven store of value with sovereign demand supporting the floor, gold is the right choice. For the full bull case on gold in 2026, see our detailed Gold Price Forecast 2026 — Will XAU/USD Hit $5,000, $6,000 or Higher? guide. If you are willing to accept significantly higher volatility in exchange for potentially much higher returns — and you believe the precious metals bull market has further to run — silver offers leverage that gold simply cannot match.
Most experienced precious metals investors hold both — gold as the core position and silver as the higher-beta complement. The combination gives you the stability of gold's structural demand floor with silver's upside leverage when the market moves in your favour.
8. How to Track Silver Prices and Make Informed Decisions
Before making any decision about silver, there are four things every investor should monitor regularly:
- The live XAG/USD spot price — track it at FloatForex's gold and silver charts alongside gold. Silver price movements are often telegraphed by gold's direction, so watching both together gives context.
- The gold-silver ratio — when the ratio is above 80:1, silver is historically cheap relative to gold. When it falls below 50:1, silver has historically become overextended. The current ratio around 65:1 sits in neutral territory.
- Federal Reserve meeting outcomes — FOMC decisions are the single most reliable short-term catalyst for precious metals. Rate cut signals push silver higher; hawkish surprises push it down.
- Silver Institute quarterly demand data — the world's most authoritative source of silver supply and demand fundamentals. When the deficit widens and industrial demand holds, the structural bull case strengthens.
Frequently Asked Questions — Silver Price 2026
Why did silver go up so much in 2025?
Silver gained 148 percent in 2025 due to a convergence of five factors: six consecutive years of structural supply deficit, explosive industrial demand from solar panels, electric vehicles, and AI data centres, US tariff uncertainty that created physical silver shortages in American markets, the return of Western investment demand through ETFs, and gold's bull market lifting the entire precious metals sector. The 2025 return was silver's best performance since 1979.
What is the silver price forecast for 2026?
Institutional forecasts range widely. JPMorgan forecasts a $81/oz full-year average for 2026. Bank of America's Michael Widmer has projected $135–$309/oz in bull-case scenarios based on historical gold-silver ratio compression. The mainstream base case from most analysts sits in the $65–$90 range for year-end 2026. The bear case — if gold's bull market ends — is $35–$40 per ounce. Silver's all-time high was $121.67 set on January 29, 2026.
Is silver a good investment in 2026?
Silver offers significant upside potential if the precious metals bull market continues — with historical precedent showing silver delivering 2–3 times gold's percentage return in late bull market phases. However, silver also carries very high volatility risk. It dropped 46 percent from its January 2026 peak within weeks. Silver is appropriate for investors who understand and can tolerate this volatility as part of a diversified portfolio. It is not a stable store of value in the way gold is. Consult a qualified financial advisor before making investment decisions.
Why does silver outperform gold in bull markets?
Silver outperforms gold in precious metals bull markets for two structural reasons. First, silver is a much smaller market than gold — the same amount of investment money moving into silver has a proportionally larger price impact. Second, silver's industrial demand creates an additional performance driver that gold lacks. When both safe-haven buying and industrial demand accelerate simultaneously, silver benefits from both forces at once. Gold benefits only from the safe-haven and monetary demand side.
What is the gold-silver ratio and why does it matter?
The gold-silver ratio measures how many ounces of silver it takes to buy one ounce of gold. When this ratio is above 80:1, silver is historically cheap relative to gold — and subsequent periods have tended to see silver outperform significantly. When the ratio falls below 50:1, silver has historically become overextended relative to gold. The current ratio of around 65:1 sits near historical averages, suggesting neither extreme undervaluation nor overvaluation. Monitor it at FloatForex's gold and silver charts alongside both spot prices.
What drives the silver price down?
Silver prices fall most sharply when: the US Dollar strengthens significantly (inverse relationship), the Federal Reserve turns unexpectedly hawkish (higher interest rates increase opportunity cost), gold's bull market reverses (investment demand collapses), industrial demand weakens (economic slowdown or thrifting by solar manufacturers), or forced selling occurs in a broad market crisis when investors liquidate positions for cash. Silver's price can fall 20–40 percent rapidly when multiple of these factors combine.
What was the highest silver price ever?
Silver reached its all-time nominal high of $121.67 per ounce on January 29, 2026 — surpassing the previous record of approximately $50 set during the Hunt Brothers episode in 1980 and again briefly in 2011. The 2026 high was driven by the convergence of structural supply deficits, surging industrial demand, tariff-driven physical market dislocations, and a parallel gold bull market. Silver subsequently corrected to around $65 by mid-2026.
Conclusion — Silver's Story Is Structural, Not Speculative
Silver's 148 percent gain in 2025 was not a bubble or a meme-stock moment. It was the result of structural forces — six years of supply deficits, the green energy revolution, the AI and electrification boom — colliding with financial forces — a gold bull market, a Fed easing cycle, a weaker dollar — at exactly the same time.
Those structural forces have not disappeared. The silver market remains in deficit for the sixth consecutive year. EVs are still being built. AI data centres are still being constructed. The Fed is still in an easing cycle. The gold bull market, while volatile, remains intact according to every major institution's year-end target.
The correction from $121 to $65 is real and significant. Anyone who bought silver at the January peak has experienced painful losses. But the structural case for silver in 2026 — the same case that drove the 2025 rally — is still intact.
Whether silver turns out to be the best investment of 2026 depends on factors nobody can predict with certainty — the Fed's policy path, the pace of industrial thrifting, and gold's direction. What can be said with confidence is that the fundamentals underlying silver's story are genuine, structural, and multi-year in duration.
That makes it worth watching very closely.
Track live silver and gold prices — free, no login required:
Live Silver Price — XAG/USD & Gold XAU/USD Charts |
All 150+ Currency Rates |
Compound Interest Calculator |
Gold Price Forecast 2026 — Full Analysis |
What Moves Gold Prices — Complete Guide
Note: This article is for informational purposes only and does not constitute financial or investment advice. Precious metals prices are highly volatile and past performance does not guarantee future results. Always consult a qualified financial advisor before making investment decisions.