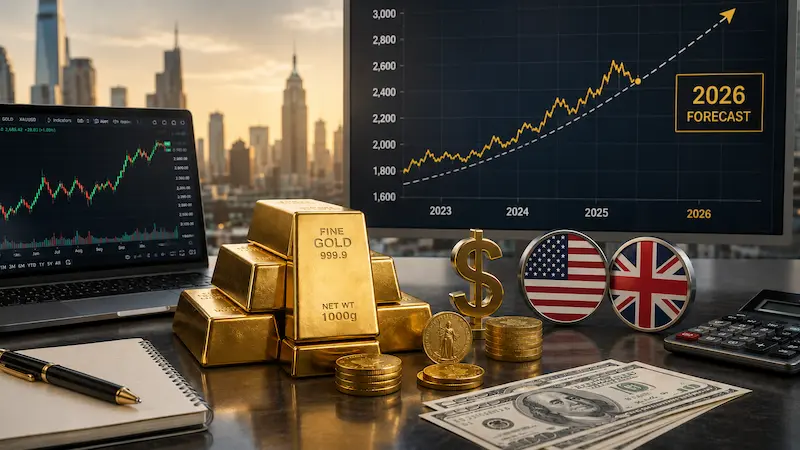

If you had told someone in 2020 that gold would be trading above $5,000 per ounce by 2026, they would have laughed. Gold was around $1,700 then. That was the ceiling in most people's minds.
It was not the ceiling.
Gold hit an all-time high of $5,589.38 per ounce on January 28, 2026 — a milestone that would have seemed unthinkable just a few years earlier. The metal doubled in value in under two years. And as of mid-2026, the world's biggest banks are still publishing price targets ranging from $5,400 to $6,300 for year-end.
So what happened? What is driving gold to these levels? And more importantly — where does it go from here?
This guide breaks down everything you need to know about the gold price forecast for 2026 — from what the major banks are saying, to the five forces pushing gold higher, to the risks that could reverse the rally. Whether you are an investor tracking XAU/USD daily, an expat deciding whether to buy gold in the UAE, or simply someone trying to understand why the gold price keeps going up — this is the analysis you need.
1. Gold Price Today and Year-End 2026 Forecast — The Direct Answer
Gold reached an all-time high of $5,589.38 per ounce on January 28, 2026 before consolidating in the $4,500–$5,000 range through mid-2026. Year-end 2026 forecasts from major banks cluster between $5,400 (Goldman Sachs) and $6,300 (JPMorgan), with the Reuters poll median of 30 analysts at $4,746 — the highest annual consensus in Reuters polling history.
Gold's journey in 2026 has been anything but linear. The metal opened the year near record highs, surged to its all-time high on January 28, then pulled back sharply. March 2026 saw the largest monthly decline since June 2013 — a correction that rattled retail investors but did not change a single major bank's year-end forecast.
The World Gold Council reported that the LBMA gold price set a new quarterly average record of $4,873 per ounce in Q1 2026 — meaning even after the pullback from the January high, the average price for the entire quarter was still the highest ever recorded. That puts the current consolidation in context: this is not a breakdown. It is a pause at a historically elevated level.
You can track the live XAU/USD gold price in real time at FloatForex's live gold charts — updated every 2 minutes from global commodity markets.
2. Gold Price Forecast 2026 — What the Major Banks Are Saying
Wall Street's top commodity desks have been consistently bullish on gold throughout 2026. Here is where the major institutions stand:
| Institution | Year-End 2026 Target | Key Rationale |
|---|---|---|
| JPMorgan | $6,300 | 800 tonnes central bank purchases, de-dollarisation |
| Deutsche Bank | $6,000 | Fed rate cuts, geopolitical risk premium |
| Yardeni Research | $6,000 | Dollar weakening, inflation persistence |
| UBS | $5,600 | Strong ETF inflows, late-cycle commodity demand |
| Goldman Sachs | $5,400 | Central bank buying, private-sector diversification |
| Morgan Stanley | $5,700 | Structural supply deficit, institutional reallocation |
| TD Securities | $5,000 avg | Safe-haven demand, Fed pivot timing |
| Reuters Poll (30 analysts) | $4,746 median | Consensus average — highest on record |
| HSBC | $4,450 | Most conservative major bank; expects correction |
| State Street | $4,000 floor | Bear case — 20% probability assigned |
What is striking about this table is not any individual forecast — it is the range. The mainstream institutional consensus clusters between $5,000 and $6,300. Even the most conservative major-bank target ($4,450 from HSBC) is still well above where gold was trading just 18 months ago. The bear case — State Street's $4,000 floor — requires a 20 percent probability event from current levels.
Goldman Sachs Senior Commodities Analyst Lina Thomas noted "significant upside risk to the forecast" even after maintaining the $5,400 target. JPMorgan's Natasha Kaneva stated: "We expect gold demand to push prices toward $5,000 per ounce by year-end 2026," with the bank's $6,300 target reflecting 800 tonnes of projected central bank buying. The Reuters poll median of 30 analysts sits at $4,746.50 — the highest annual consensus in Reuters polling history dating back to 2012.
3. Five Forces Driving Gold Higher in 2026
Understanding why gold is at these levels requires understanding the five structural forces that have converged simultaneously — something that has rarely happened in gold's modern history.
Force 1 — Central Banks Are Buying at an Unprecedented Rate
This is the single biggest structural driver of gold prices in 2026 — and it is unlike anything seen in the post-Bretton Woods era.
Central banks globally purchased over 1,100 tonnes of gold in 2025 — the third consecutive year above 1,000 tonnes, and far above the historical pre-2022 average of around 400–500 tonnes per year. A record 43 percent of central banks now plan to increase their gold holdings in 2026, up from 29 percent just two years ago.
China's central bank extended its buying streak to 14 consecutive months through 2025, accumulating over 2,303 tonnes of gold reserves. Poland, India, Turkey, and several other emerging market central banks have been equally aggressive buyers.
The motivations are structural, not speculative: diversification away from US Treasuries, hedging against inflation, and reducing dependence on the US dollar as a reserve asset. Central banks buying gold are making strategic reserve decisions — not trading for profit. They buy at $4,000 and they buy at $5,500. This price-insensitive, long-term buying creates a structural floor under gold prices that individual investors and ETF flows simply cannot replicate.
Notably, gold now accounts for a larger share of central bank reserves than US Treasuries for the first time since 1996 — a seismic shift in global reserve management that reinforces the structural demand story.
Force 2 — The US Dollar Is Under Pressure
Gold and the US Dollar have a well-established inverse relationship. When the dollar strengthens, gold typically falls in dollar terms — and vice versa. In 2026, the dollar faces significant headwinds that favour gold.
The Federal Reserve's rate-cutting cycle — three consecutive cuts in 2025 — has reduced the yield advantage of holding dollar-denominated assets. Lower US interest rates reduce the opportunity cost of holding gold, which pays no interest. ING analysts confirm: "gold's main drivers, including central bank buying, Fed rate cuts, a weaker dollar, concerns about the Fed's independence, and ETF buying, are all still in place."
Political uncertainty around US monetary policy has added another layer of dollar weakness. Concerns about Federal Reserve independence — amplified by political tensions in Washington — have prompted foreign investors to question the dollar's reserve currency status. When confidence in the dollar wavers, gold fills the vacuum.
Force 3 — Geopolitical Risk Premium Is Elevated
Gold has always been the world's premier safe-haven asset during periods of geopolitical stress. In 2026, the geopolitical risk premium is as elevated as it has been in decades.
Ongoing conflicts, trade war tensions, and institutional uncertainty have created an environment where traditional risk assets — equities, corporate bonds, some government debt — feel less reliable to a significant segment of global investors. Gold does not have counterparty risk. It cannot default. It cannot be sanctioned away from its owner in the same way that dollar reserves held at the Federal Reserve can be frozen — as Russia discovered in 2022.
The World Gold Council's Q1 2026 demand report confirms: "Geopolitics remain front and centre in our outlook for gold demand in 2026. Our view remains that investment and central bank demand will be supported by ongoing geopolitical risk."
Force 4 — ETF Demand Has Returned
Gold ETFs — exchange-traded funds backed by physical gold — were a significant source of selling pressure during the 2022–2023 period when rising interest rates made yield-bearing assets more attractive. That dynamic has reversed sharply.
December 2025 marked the seventh consecutive month of positive global gold ETF flows. North American funds led the charge, with holdings approaching all-time highs. Eastern ETF inflows are more than compensating for any Western fund outflows, maintaining net positive ETF demand globally.
When ETF buyers and central bank buyers are both active simultaneously — as they are now — the combined demand effect is powerful. Mine supply grows slowly (global gold production increased just 2 percent year-on-year in Q1 2026). The supply-demand math strongly favours higher prices.
Force 5 — The De-Dollarisation Trend Is Accelerating
Perhaps the most important long-term structural force behind gold's 2026 rally is the accelerating trend of global de-dollarisation — the gradual reduction in the US dollar's dominance as the world's reserve currency and primary medium of international trade settlement.
Countries across Asia, the Middle East, and emerging markets are actively reducing their dollar holdings and diversifying into gold. JPMorgan analysts specifically noted that "if diversification of just 0.5 percent of foreign US asset holdings into gold took place, it would be enough new demand to drive prices to $6,000 per ounce." The sheer scale of global dollar holdings means even small percentage shifts generate enormous gold demand.
This is not a short-term trading theme. It is a multi-decade structural shift — which is why even at $5,000+ per ounce, central banks are still buying.
4. Bull Case vs Bear Case — What Could Push Gold to $6,000 and What Could Stop It
The bull case and bear case for gold in the second half of 2026 are both well-defined.
The Bull Case — What Gets Gold to $6,000+
- Federal Reserve rate cuts: If the Fed signals or delivers further rate cuts in H2 2026, dollar weakness would accelerate and gold's opportunity cost falls further. Each 25 basis point cut tends to provide a meaningful tailwind for gold.
- Central bank buying above 800 tonnes: The World Gold Council projects 700–900 tonnes for 2026. If buying runs at the upper end, the supply-demand imbalance widens.
- Dollar weakening against major currencies: A sustained DXY decline would boost gold in dollar terms mechanically, regardless of other factors.
- Escalation of geopolitical risk: Any significant new conflict, sanctions event, or financial system stress drives immediate safe-haven buying into gold.
- Portfolio reallocation: The World Gold Council notes that portfolio reallocation from traditional 60/40 frameworks toward gold-inclusive allocations is gaining institutional traction. If this becomes mainstream, the incremental demand is enormous.
The Bear Case — What Could Stop the Rally
- Federal Reserve staying higher for longer: If inflation remains stubborn and the Fed keeps rates elevated through 2026, the opportunity cost of holding gold stays high. Higher-than-expected US rates are the most reliable bearish catalyst for gold.
- Geopolitical de-escalation: A significant reduction in global tensions would reduce safe-haven demand. This is a lower-probability scenario given current geopolitics, but it is a genuine risk to gold's premium.
- Forced selling in a market crisis: In a sudden equity market crash, investors sometimes sell gold to raise cash quickly — as happened briefly in March 2020. This typically creates short-term dips rather than structural reversals, but the dips can be sharp.
- Dollar strengthening sharply: If the US economy significantly outperforms expectations and global investors flood back into dollar assets, the inverse relationship would weigh on gold prices.
- Capital Economics bear case: Capital Economics predicted gold could fall to $3,500 by end-2026 — the most bearish mainstream forecast. This scenario requires a simultaneous resolution of geopolitical risk, Fed hawkishness, and an end to central bank buying. Each of those alone seems unlikely; all three together is an extreme tail risk.
5. The Gold Price Rally in Historical Context
It helps to step back and appreciate just how remarkable gold's recent performance has been.
Gold has been in an uptrend on the monthly continuation chart since early 2019. The 2025 returns were the best since 1979 in US dollar terms — and the best in rupee terms since 1996. Gold surpassed $4,000 per ounce for the first time in October 2025, then reached $5,000 within months.
The speed and scale of this rally is unusual even by gold's historical standards. What makes it different from previous gold bull markets is the combination of drivers: previous rallies were typically dominated by one or two factors — the 1970s rally was inflation-driven, the 2008–2011 rally was financial crisis-driven. The 2024–2026 rally is simultaneously driven by central bank buying, de-dollarisation, geopolitical risk, ETF flows, and a Fed easing cycle. When multiple structural forces converge, they can sustain higher prices for longer than any single driver could.
6. Gold Price Scenarios for H2 2026 — Realistic Probabilities
Setting aside the extreme scenarios on both ends, here is a realistic framework for thinking about where gold goes in the second half of 2026:
| Scenario | Conditions | Gold Price Range | Probability |
|---|---|---|---|
| Bull case | Fed cuts rates, dollar weakens, central banks buy 800+ tonnes | $5,500–$6,300 | 35% |
| Base case | Gradual Fed easing, geopolitical risk stays elevated, ETF flows positive | $4,700–$5,400 | 45% |
| Bear case | Fed hawkish surprise, dollar strengthens, risk-off selling | $3,800–$4,300 | 20% |
The Reuters poll of 30 analysts gives a median 2026 average of $4,746.50 — consistent with the base case range above. Most professional forecasters expect gold to end the year higher than it started, with meaningful upside potential if Fed rate cuts materialise on schedule.
7. What the Gold Price Forecast Means for Gulf and UAE Investors
For the millions of investors, expats, and savers in the UAE and wider Gulf region, the gold price outlook has direct practical implications.
The UAE has one of the world's most active physical gold markets — Dubai is a global gold trading hub (see how Dubai gold prices compare with India and Pakistan), and physical gold buying for savings and investment is deeply embedded in South Asian and Middle Eastern culture. With the AED pegged to the USD at 3.6725, UAE residents buying or selling gold are effectively transacting in dollar terms — making the XAU/USD price directly relevant to every gold decision made in Dubai or Abu Dhabi.
Key considerations for UAE-based gold investors:
- Timing entries carefully: Gold's current consolidation between $4,500–$5,000 may offer better entry points than the January 2026 all-time high. The 200-day moving average near $4,200–$4,260 has historically provided strong support in this bull market.
- Watching US Federal Reserve meetings: Fed decisions are the single most reliable short-term catalyst for gold price moves. Rate cut signals push gold up; hawkish surprises push gold down. Key FOMC meetings in H2 2026 will be pivotal.
- Following central bank data: The World Gold Council publishes quarterly demand data. Sustained central bank buying above 700 tonnes per year is the structural support for current price levels.
- Tracking the DXY dollar index: When the DXY falls below key support levels, gold typically rallies. The inverse relationship between the dollar and gold is one of the most reliable relationships in financial markets.
You can monitor the live gold price and XAU/USD chart in real time at FloatForex's gold charts — free, no account required, updated every 2 minutes.
Frequently Asked Questions — Gold Price Forecast 2026
What is the gold price forecast for end of 2026?
The mainstream institutional consensus for year-end 2026 ranges from $5,400 (Goldman Sachs) to $6,300 (JPMorgan). The Reuters poll median of 30 analysts is $4,746.50 per ounce for the full-year 2026 average. The most bullish mainstream target is JPMorgan's $6,300, built on projected central bank purchases of 800 tonnes. The most bearish mainstream forecast is Capital Economics at $3,500 — a scenario most other analysts consider unlikely.
Why is the gold price so high in 2026?
Five simultaneous factors have driven gold to record levels: record central bank buying (over 1,100 tonnes in 2025), US dollar weakness driven by Fed rate cuts, elevated geopolitical risk premiums, the return of ETF investor buying, and accelerating global de-dollarisation as countries diversify reserves away from US Treasuries. The convergence of all five factors simultaneously is historically unusual and explains the exceptional scale of the rally.
Will gold reach $6,000 per ounce?
JPMorgan, Deutsche Bank, and Yardeni Research all have $6,000+ targets for 2026. JPMorgan's analysis shows that if just 0.5 percent of global foreign US asset holdings were redirected into gold, that alone would generate sufficient demand to push prices to $6,000 per ounce. Whether this happens depends primarily on the pace of Fed rate cuts and the sustained level of central bank buying. It is within the realistic range of outcomes — not a fringe scenario.
Is now a good time to buy gold in 2026?
This depends entirely on your investment horizon and risk tolerance. Gold has pulled back significantly from its January 2026 all-time high of $5,589 — the current consolidation zone around $4,500–$5,000 is meaningfully below the peak. Most institutional analysts maintain bullish year-end targets, suggesting the medium-term trend remains upward. However, the bear case ($3,500–$3,800) is a real scenario if US economic data surprises to the upside and the Fed turns hawkish. Gold is best approached as part of a diversified portfolio, not an all-in trade. Consult a qualified financial advisor before making investment decisions.
What is the relationship between gold and the US dollar?
Gold and the US dollar have a well-established inverse relationship. When the dollar strengthens (DXY rises), gold priced in dollars typically falls because it becomes more expensive for buyers using other currencies. When the dollar weakens, gold priced in dollars typically rises. This relationship is not perfect — both assets can rise simultaneously during periods of extreme uncertainty — but it is one of the most reliable correlations in commodity markets.
How can I track the live gold price?
FloatForex provides the live XAU/USD gold spot price updated every 2 minutes from global commodity markets — free, with no login required. Visit FloatForex's gold charts for the live chart, current spot price, and daily price movement data for both gold and silver.
What is the all-time high price of gold?
Gold reached its all-time high of $5,589.38 per ounce on January 28, 2026. The previous major milestone was $4,000 per ounce, first crossed in October 2025. The metal has more than doubled from its mid-2024 levels, driven primarily by record central bank buying and accelerating global de-dollarisation.
Conclusion — Gold's Bull Market Has Structural Support
Gold's 2026 rally is not a bubble driven by speculation. It is a structurally supported move built on the simultaneous convergence of central bank buying at historic levels, dollar weakness, geopolitical risk, ETF demand recovery, and a global re-evaluation of what constitutes a safe reserve asset.
The short-term path is uncertain — corrections of 15–20 percent are normal and healthy within broader bull markets, as 2026 has already demonstrated. But the medium-term structural case for gold remains intact. The world's biggest banks have not abandoned their $5,400–$6,300 targets. Central banks are still buying. The de-dollarisation trend is still accelerating. The Fed is still in an easing cycle.
Whether you are a long-term investor, a UAE expat considering physical gold, or simply someone trying to understand why the gold price keeps making headlines — the forces driving this market are real, structural, and unlikely to reverse quickly.
Track the live gold price, read the latest XAU/USD chart, and compare silver prices alongside gold — all free at FloatForex.com:
- Live Gold Price — XAU/USD Chart
- All Live Currency Rates — 150+ Pairs
- Compound Interest Calculator — Plan Your Gold Investment Returns
- What Moves Gold Prices — The Complete Beginner's Guide
- Silver Surged 148% in 2025 — Why It Could Be the Best Investment of 2026
Note: This article is for informational purposes only and does not constitute financial or investment advice. Gold prices are volatile and past performance is not a guarantee of future results. Always consult a qualified financial advisor before making investment decisions.