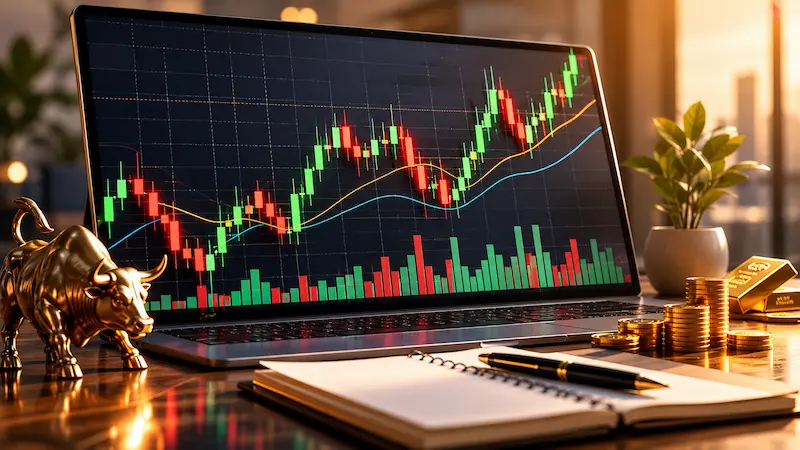

If you have ever looked at a forex or gold price chart and felt confused by the series of coloured blocks and lines, you are not alone. Candlestick charts are the most widely used chart type in financial trading — and once you understand how to read them, they reveal a remarkable amount of information about where price has been and where it might be heading.
This guide explains everything a beginner needs to know about candlestick charts — what they are, how to read them, what the most important patterns mean, and how to use them when analysing live forex and gold prices.
What Is a Candlestick Chart?
A candlestick chart is a type of financial chart used to display the price movement of an asset over a specific time period. Each individual candlestick shows four key data points: the opening price, the closing price, the highest price reached, and the lowest price reached during that period.
Candlestick charts were originally developed by Japanese rice traders in the 18th century and have since become the standard method of displaying price data in forex, gold, stock, and cryptocurrency markets worldwide. They convey significantly more information than simple line charts and allow traders to identify patterns that suggest future price direction.
How to Read a Single Candlestick
Every candlestick has three components:
- The body — the wide rectangular section showing the range between the opening and closing price
- The upper shadow (wick) — the thin line above the body showing the highest price reached
- The lower shadow (wick) — the thin line below the body showing the lowest price reached
The colour of the body tells you the direction of price movement during that period. A green or white body means the price closed higher than it opened — buyers were in control. A red or black body means the price closed lower than it opened — sellers were in control.
What Is the Difference Between a Bullish and Bearish Candlestick?
A bullish candlestick is one where the closing price is higher than the opening price, indicating buying pressure dominated during that time period. On most platforms bullish candlesticks are displayed in green or white.
A bearish candlestick is one where the closing price is lower than the opening price, indicating selling pressure dominated. Bearish candlesticks are typically displayed in red or black.
The length of the body matters too. A long green body signals strong buying momentum. A short body of either colour signals indecision or weak momentum. Long wicks — particularly upper wicks on a green candle — suggest buyers pushed price higher but sellers pushed it back down before the close, a potential warning sign for buyers.
What Are the Most Important Candlestick Patterns?
Individual candlesticks provide information but patterns formed by two or more candlesticks in sequence are what traders primarily use to make trading decisions. Here are the most important patterns every beginner should learn:
What Is a Doji Candlestick?
A Doji is a candlestick where the opening and closing price are virtually identical, resulting in a very small or nonexistent body. A Doji signals complete indecision between buyers and sellers. When a Doji appears after a strong trend it can signal that the trend is losing momentum and a reversal may follow.
What Is a Hammer Candlestick?
A Hammer is a candlestick with a small body near the top and a long lower shadow — at least twice the length of the body. It forms when price falls significantly during the period but buyers push it back up near the opening price before the close. A Hammer appearing at the bottom of a downtrend is a bullish reversal signal suggesting buyers are beginning to take control.
What Is a Shooting Star Candlestick?
A Shooting Star is the opposite of a Hammer — a small body near the bottom with a long upper shadow. It forms when price rises significantly during the period but sellers push it back down before the close. A Shooting Star appearing at the top of an uptrend is a bearish reversal signal suggesting sellers are beginning to take control.
What Is a Bullish Engulfing Pattern?
A Bullish Engulfing pattern consists of two candlesticks. The first is a small bearish (red) candle followed immediately by a larger bullish (green) candle whose body completely engulfs the body of the previous candle. This pattern signals a shift from selling to buying momentum and is considered one of the strongest bullish reversal signals when it appears at the bottom of a downtrend.
What Is a Bearish Engulfing Pattern?
A Bearish Engulfing pattern is the opposite — a small bullish candle followed by a larger bearish candle that completely engulfs it. This pattern signals a shift from buying to selling momentum and is a strong bearish reversal signal when it appears at the top of an uptrend.
What Is a Morning Star Pattern?
A Morning Star is a three-candlestick bullish reversal pattern. It begins with a long bearish candle, followed by a small-bodied candle showing indecision, and concludes with a long bullish candle. The Morning Star signals that selling pressure has exhausted itself and buyers are taking control — particularly powerful when it appears after a prolonged downtrend.
How Do Traders Use Candlestick Charts in Forex Trading?
Forex traders use candlestick charts to identify trend direction, potential reversal points, and the strength of price movements. The process typically involves:
- Identifying the overall trend direction by looking at the sequence of candlesticks over a longer period
- Finding key support and resistance levels where price has repeatedly reversed
- Watching for reversal candlestick patterns at those key levels
- Using the pattern as a signal to enter or exit a trade
- Confirming the signal with other indicators like RSI or moving averages before acting
The most commonly used timeframes for forex candlestick analysis are the 1-hour, 4-hour, and daily charts. Shorter timeframes like the 5-minute or 15-minute chart are used by active day traders while longer timeframes are used by swing and position traders.
How to Read Gold Price Candlestick Charts
Gold (XAU/USD) is one of the most actively traded instruments using candlestick analysis. The same principles apply — bullish and bearish candles, shadow length, and pattern formation — but gold has some unique characteristics that affect how candlestick signals should be interpreted.
Gold tends to move in strong directional trends driven by Federal Reserve policy, inflation data, and geopolitical risk. This means trend-following candlestick patterns — such as sequences of strong bullish engulfing candles — tend to be particularly reliable in gold compared to more range-bound instruments.
Gold also experiences sharp spike moves during major news events — visible as long-wicked candlesticks with small bodies. These Doji-type formations during news releases often signal temporary volatility rather than genuine trend reversals, so context matters significantly when reading gold candlestick charts.
You can view live XAU/USD gold price candlestick charts updated in real time at FloatForex.com/gold-charts — free, no account required.
What Is the Difference Between a Candlestick Chart and a Line Chart?
A line chart connects only the closing prices of each period with a continuous line. It shows the general direction of price movement but provides no information about how price moved within each period — the highs, lows, or where price opened.
A candlestick chart shows all four price points — open, high, low, and close — for every period. This additional information allows traders to identify patterns, gauge the strength of moves, and spot potential reversals that would be completely invisible on a line chart.
For this reason virtually all professional traders and analysts use candlestick charts rather than line charts for their analysis.
Common Mistakes Beginners Make With Candlestick Charts
- Trading every pattern without context — A Hammer candlestick at a major support level is significant. The same pattern in the middle of a range is not. Context determines whether a pattern is meaningful.
- Ignoring the trend — Bullish reversal patterns are only relevant at the bottom of downtrends. Bearish reversal patterns are only relevant at the top of uptrends. Trading them in the wrong context leads to poor results.
- Using only one timeframe — A pattern on a 5-minute chart means very little if the daily chart shows a strong opposite trend. Always check higher timeframes first.
- Forgetting about volume — Candlestick patterns carry more weight when accompanied by above-average trading volume. A reversal pattern with low volume is far less reliable than one with high volume.
Where Can I See Live Candlestick Charts for Free?
Live candlestick charts for gold (XAU/USD) and major forex currency pairs including USD to EUR, USD to GBP, and USD to JPY are available at FloatForex.com/gold-charts — updated continuously throughout the trading day, completely free with no account or subscription required.
Frequently Asked Questions About Candlestick Charts
What is a candlestick chart?
A candlestick chart is a financial chart displaying price movement through individual candlesticks. Each candlestick shows four prices: open, close, high, and low for a specific time period. It is the most widely used chart type in forex and gold trading.
How do you read a candlestick chart?
Look at the body colour first. Green or white means price rose during that period. Red or black means price fell. The upper wick shows the highest price reached. The lower wick shows the lowest price reached. The top and bottom of the body show where price opened and closed.
What is the most reliable candlestick pattern?
The Engulfing pattern — both bullish and bearish — is widely considered one of the most reliable candlestick patterns, particularly when it appears at key support or resistance levels with above-average volume confirming the move.
Can candlestick charts be used for gold trading?
Yes. Candlestick analysis applies equally to gold (XAU/USD) as it does to forex currency pairs. Gold traders use the same patterns — Hammers, Doji, Engulfing — to identify potential reversals and trend continuations. Live gold candlestick charts are available free at FloatForex.com/gold-charts.
What timeframe should beginners use for candlestick analysis?
Beginners should start with the daily chart — each candlestick represents one full trading day. Daily charts filter out short-term noise and make patterns cleaner and more reliable. Once comfortable with daily charts, move to the 4-hour chart for more trading opportunities.