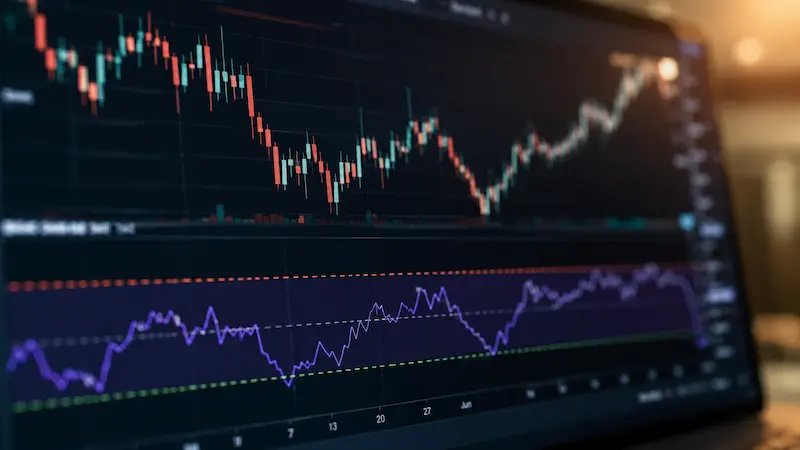

The Relative Strength Index — RSI — is one of the most widely used technical indicators in trading. It appears on almost every trading platform, is referenced in almost every technical analysis conversation, and is frequently misused by traders who understand what it shows but not what it actually means.
This guide explains what RSI actually measures, how to read it correctly, where most traders go wrong with it, and how professionals use it as part of a broader trading approach rather than a standalone signal.
What Is the RSI Indicator?
RSI stands for Relative Strength Index. It was developed by technical analyst J. Welles Wilder Jr. and introduced in his 1978 book New Concepts in Technical Trading Systems — making it one of the oldest and most tested indicators in existence.
RSI is a momentum oscillator. It measures the speed and magnitude of recent price changes to evaluate whether an asset is being overbought or oversold. The indicator produces a reading between 0 and 100 — always. It cannot go above 100 or below 0.
The two critical levels are:
- Above 70 — the asset is considered overbought. Price has risen too far too fast and may be due for a pullback or reversal.
- Below 30 — the asset is considered oversold. Price has fallen too far too fast and may be due for a bounce or reversal.
These are not fixed rules. They are probability signals — and understanding the difference between a rule and a probability signal is what separates traders who use RSI effectively from those who lose money following it blindly.
How Is RSI Calculated?
You do not need to calculate RSI manually — every trading platform does it automatically. But understanding the calculation helps you understand what the indicator is actually telling you.
RSI uses the following formula:
RSI = 100 — (100 / (1 + RS))
Where RS (Relative Strength) equals the average gain over the period divided by the average loss over the period.
The default period is 14 — meaning RSI looks at the last 14 candles (bars) on whatever timeframe you are using. If you are on a daily chart, it looks at the last 14 days. If you are on a 1-hour chart, it looks at the last 14 hours.
When recent gains have significantly outpaced recent losses — when the market has been moving strongly upward — RS is high and RSI approaches 100. When recent losses have significantly outpaced recent gains, RS is low and RSI approaches 0.
How to Read RSI — The Three Signals
RSI generates three distinct types of signals. Each has different reliability and different applications.
Signal 1 — Overbought and Oversold Levels
This is the most basic RSI signal and the one most widely taught. When RSI rises above 70, the asset is overbought and a reversal or pullback may be approaching. When RSI falls below 30, the asset is oversold and a bounce or reversal may be approaching.
The critical mistake most beginners make is treating these levels as automatic buy or sell signals. An RSI above 70 does not mean sell immediately. In a strong uptrend, RSI can remain above 70 for extended periods — sometimes weeks — while price continues rising. Selling every time RSI crosses 70 in a bull market is one of the most reliable ways to lose money.
The correct interpretation: RSI above 70 means momentum is extended and you should be more cautious about new long entries — not that you should immediately short the market.
Signal 2 — RSI Divergence
RSI divergence is considered by many professional traders to be the most reliable signal RSI generates — and it is significantly less discussed than the overbought/oversold levels.
Divergence occurs when price and RSI move in opposite directions:
- Bearish divergence — price makes a higher high but RSI makes a lower high. Price is rising but momentum is weakening. This suggests the uptrend may be losing strength and a reversal could be approaching.
- Bullish divergence — price makes a lower low but RSI makes a higher low. Price is falling but momentum is weakening to the downside. This suggests the downtrend may be losing strength and a reversal or bounce could be approaching.
Divergence does not guarantee a reversal — nothing in technical analysis does. But it is a higher-probability signal than a simple overbought or oversold reading because it shows a structural disconnect between price action and momentum.
Signal 3 — RSI Centerline Cross
The 50 level on RSI acts as a centerline separating bullish from bearish momentum. When RSI crosses above 50 from below, it signals that bullish momentum is taking over. When RSI crosses below 50 from above, it signals that bearish momentum is taking over.
This signal is used less for timing entries and more for understanding the broader momentum context — whether the underlying trend is bullish or bearish before applying the overbought/oversold signals.
RSI in Forex Trading — Practical Examples
RSI is widely used across forex pairs but works differently depending on whether the pair is trending or ranging.
In ranging markets — where price is moving sideways within a defined range — RSI overbought and oversold signals work very well. When price reaches the top of the range and RSI hits 70+, the probability of a pullback is high. When price reaches the bottom of the range and RSI hits 30 or below, the probability of a bounce is high.
Currency pairs like EUR/USD and USD/CHF often spend extended periods in defined ranges — making RSI particularly applicable for trading those conditions.
In trending markets — where price is moving strongly in one direction — RSI overbought and oversold signals are significantly less reliable. In a strong USD/JPY uptrend, for example, RSI may repeatedly hit 70+ without any meaningful reversal. Trading against the trend because RSI is overbought is a common and costly mistake.
The professional approach in trending markets is to use RSI pullbacks — waiting for RSI to dip toward 40-50 in an uptrend before looking for long entries, rather than buying overbought signals or shorting when RSI hits 70.
Track live mid-market exchange rates for EUR/USD, USD/JPY, USD/CHF and all major currency pairs at floatforex.com/currencies — understanding the current rate context helps you identify which pairs are trending versus ranging before applying RSI analysis.
RSI on Gold (XAU/USD) — Why It Works Particularly Well
Gold is one of the markets where RSI divergence signals have historically been particularly reliable. This is because gold tends to move in well-defined swing structures — large directional moves followed by consolidations — that create clean divergence setups on both daily and weekly timeframes.
When XAU/USD makes a new price high but RSI fails to confirm with a new RSI high — particularly on the daily or weekly chart — it has historically been one of the more reliable signals that the gold rally is losing momentum and a correction may be approaching.
Similarly, when gold makes a new price low during a correction but RSI makes a higher low — bullish divergence — it has frequently preceded significant gold price recoveries.
You can monitor live XAU/USD gold price charts across multiple timeframes at floatforex.com/gold-charts — applying RSI analysis to the live chart data gives you real-time context for the signals described above.
Common RSI Mistakes to Avoid
- Using RSI as a standalone signal — RSI works best when combined with support and resistance levels, trend analysis, and price action context. An RSI oversold reading at a major support level is significantly more reliable than an RSI oversold reading in the middle of a trend.
- Trading against strong trends — In a powerful uptrend, RSI can remain overbought for extended periods. Always identify the trend direction before applying RSI signals.
- Ignoring divergence — Most traders focus exclusively on the 70/30 levels and miss divergence entirely. Divergence is typically the higher probability signal.
- Using the wrong timeframe — RSI on a 1-minute chart generates dozens of signals daily, most of which are noise. RSI on daily and weekly charts generates fewer signals that are significantly more meaningful.
- Changing the period constantly — The default 14-period RSI has been tested across decades and markets. Changing to RSI(7) or RSI(21) without a clear reason is usually counterproductive.
RSI Settings — What Period to Use
The standard RSI period is 14 — the setting Wilder originally recommended and the most widely used by professional traders. This is the default on virtually every trading platform and the setting that most technical analysis research is based on.
Some traders use shorter periods:
- RSI(9) — more sensitive, generates more signals, more false signals. Better for shorter timeframe trading.
- RSI(21) — less sensitive, generates fewer signals, higher reliability per signal. Better for longer timeframe position trading.
For most traders — particularly those using RSI on daily or 4-hour charts for forex and gold — the default RSI(14) with 70/30 levels is the appropriate starting point.
How to Use RSI Effectively — A Practical Framework
Here is a practical framework for using RSI that combines the signals above into a coherent approach:
- Identify the trend first — Is the market trending or ranging? Use moving averages or price structure to determine this before applying RSI.
- In ranging markets — Look for RSI above 70 near range resistance for short entries and RSI below 30 near range support for long entries.
- In trending markets — Look for RSI pullbacks to the 40-50 zone in uptrends for long entries. Avoid shorting overbought readings in strong uptrends.
- Always check for divergence — Before any entry, check whether price and RSI are confirming each other or diverging. Divergence changes the probability of any setup significantly.
- Combine with price levels — An RSI signal at a key support or resistance level is significantly more reliable than an RSI signal in isolation.
For traders following gold markets, applying this framework to live XAU/USD data at floatforex.com/gold-charts provides real market context for practising RSI analysis on one of the most technically reliable markets available.
The Bottom Line on RSI
RSI is a genuinely useful tool — one of the few technical indicators with decades of research supporting its effectiveness under the right conditions. The traders who benefit from it most are those who understand its limitations as clearly as its strengths.
Used correctly — combined with trend analysis, key price levels, and divergence monitoring — RSI adds meaningful probabilistic context to trading decisions. Used incorrectly — as an automatic buy at 30 and sell at 70 system — it will produce losses with frustrating regularity.
The difference between those two outcomes is not the indicator. It is the understanding of what the indicator actually measures and where it is and is not applicable.
For more technical analysis guides and live market data including real-time gold charts and currency pair rates, visit floatforex.com/blog