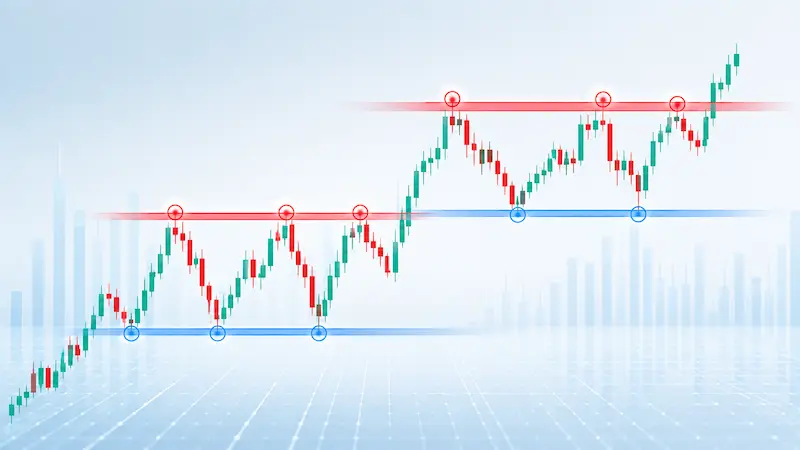

Support and resistance levels are the foundation of technical analysis. Every professional forex trader, gold analyst, and market technician uses them daily — yet most beginners struggle to identify them correctly on a live chart. This step by step guide explains exactly how to find support and resistance levels on any forex or gold chart, why they work, and how to use them to make better trading decisions.
What Are Support and Resistance Levels?
Before learning how to identify support and resistance levels, you need a precise understanding of what they actually are.
Support is a specific price level on a chart where buying interest is historically strong enough to prevent price from falling further. When price approaches a support level, buyers tend to enter the market, creating demand that pushes price back upward. Support levels are identified by looking at previous price lows where price reversed upward multiple times.
Resistance is a specific price level where selling pressure is historically strong enough to prevent price from rising further. When price approaches a resistance level, sellers tend to enter the market, overwhelming buyers and pushing price back downward. Resistance levels are identified by looking at previous price highs where price was rejected downward multiple times.
The more times a price level has acted as support or resistance in the past, the stronger and more significant it is considered. A level that has held four times is far more important than one that has held once.
Why Do Support and Resistance Levels Work?
Support and resistance levels work because of market memory and trader psychology. When price reaches a level where it previously reversed, traders who were active at that level remember it. Buyers who missed a previous rally at a support level wait for price to return so they can buy again. Sellers who missed a previous decline at a resistance level wait for price to return so they can sell again. This collective memory creates self-fulfilling price reactions at key levels.
This principle applies equally to forex currency pairs like USD to EUR, USD to GBP, and USD to JPY, as well as gold (XAU/USD) — which you can track in real time at FloatForex.com/gold-charts.
What Do You Need Before Identifying Support and Resistance?
Before you start drawing levels on a chart you need three things in place:
- A clean price chart — remove unnecessary indicators initially. Support and resistance analysis works best on a clean chart showing only price action.
- The right timeframe — support and resistance levels on higher timeframes (daily, weekly) are more significant than those on lower timeframes (5 minute, 15 minute). Always start with the daily chart.
- Live accurate price data — you cannot draw meaningful levels on delayed data. Use a real-time chart source like FloatForex.com/gold-charts for gold and FloatForex.com/currencies for forex pairs.
Step 1 — Start With the Daily Chart and Zoom Out
The first step to identifying support and resistance levels is to zoom out on a daily chart and look at the last 6 to 12 months of price history. This wider view reveals the most important levels — the ones that have been tested multiple times and are therefore most likely to matter in the future.
Do not start on a 5 minute or 15 minute chart. Short timeframe charts show dozens of minor levels that have little predictive value. The daily chart shows you the levels that institutional traders, banks, and large funds are watching — which are the levels that actually cause significant price reactions.
On a gold chart for example, zooming out to the daily view on XAU/USD will immediately reveal obvious price levels where gold has bounced upward multiple times or been rejected downward multiple times. These are your primary support and resistance zones.
Step 2 — Identify Obvious Price Swing Points
The second step is to identify the obvious swing highs and swing lows on the chart. A swing high is a candlestick with a higher high than the candlesticks immediately before and after it — a visible peak. A swing low is a candlestick with a lower low than the candlesticks immediately before and after it — a visible trough.
These swing points are the raw material of support and resistance analysis. Every significant swing high is a potential resistance level. Every significant swing low is a potential support level.
When identifying swing points follow this rule: look for obvious levels that jump out at you visually. If you have to search hard for a level it is probably not significant. The most important support and resistance levels are immediately visible to any experienced trader looking at the same chart — they are not hidden.
Step 3 — Draw Horizontal Lines at Key Price Levels
The third step is to draw horizontal lines across the chart at your identified swing highs and swing lows. These horizontal lines represent your support and resistance levels.
The key rules for drawing these lines correctly are:
- Draw through the body of candles not necessarily the wick — wicks often represent temporary price spikes. The body of the candlestick shows where price spent most of its time during that period and is usually more meaningful for level identification.
- Think in zones not exact lines — price rarely reverses at an exact number. Support and resistance are better thought of as zones — areas of 10 to 30 pips around a key level where price tends to react. Do not be too precise.
- Prioritise levels that have been tested multiple times — a level touched and respected four times is significantly more important than one touched once. Weight your analysis toward frequently tested levels.
- Look for confluence — when a round number like 1.1000 in EUR/USD coincides with a previous swing high, that level has double significance. Round numbers attract institutional orders and previous swing highs attract technical traders — both groups react at the same price, making the level more powerful.
Step 4 — Identify Which Levels Are Support and Which Are Resistance
The fourth step is to classify each level you have drawn as either support or resistance relative to current price.
The rule is simple: any level below the current market price is a support level. Any level above the current market price is a resistance level. As price moves, these classifications change — what was resistance above the market becomes support once price has broken through it.
This concept of levels switching roles is called role reversal and is one of the most powerful principles in technical analysis. When price breaks above a resistance level and holds above it, that level becomes a new support level. When price breaks below a support level and holds below it, that level becomes a new resistance level.
Role reversal works because traders who were selling at a resistance level — expecting price to fall — are now trapped in losing positions once price breaks higher. If price returns to that level they are relieved to exit at breakeven, creating buying pressure that turns the old resistance into new support.
Step 5 — Rank Your Levels by Importance
Not all support and resistance levels are equal. The fifth step is to rank your identified levels by significance so you know which ones deserve the most attention.
Rank levels higher when:
- They have been tested three or more times and held
- They coincide with a round number (1.1000, 1.2500 in EUR/USD or 2000, 2500 in gold)
- They formed on a higher timeframe (weekly levels are more significant than daily levels)
- They coincide with a previous all-time high, all-time low, or multi-year extreme
- Multiple timeframes show a level at the same price area (daily and weekly both showing support at the same zone)
Rank levels lower when:
- They have only been tested once
- They formed on a low timeframe (15 minute or 1 hour)
- They were only briefly respected before price moved through them
Step 6 — Apply Levels to Live Charts and Wait for Price Reaction
The sixth and final step is to apply your identified levels to a live chart and observe how price behaves when it approaches them. This is where support and resistance analysis generates actual trading insight.
Watch for these price reactions at your identified levels:
Bounce reaction at support — price approaches a support level, slows down, forms one or more bullish candlestick patterns (hammer, bullish engulfing, morning star), and reverses upward. This confirms the level is holding and buyers are defending it.
Rejection at resistance — price approaches a resistance level, stalls, forms bearish candlestick patterns (shooting star, bearish engulfing), and reverses downward. This confirms sellers are defending the resistance level.
Breakout through a level — price approaches a support or resistance level with strong momentum, breaks through it convincingly with a large-bodied candlestick, and closes beyond the level. A genuine breakout often leads to a sustained move in the breakout direction.
False breakout — price briefly breaks through a support or resistance level but immediately reverses back inside the range. False breakouts are actually strong signals — they trap traders who entered on the breakout and the resulting reversal can be powerful. Experienced traders watch for false breakouts at key levels as high-probability trade setups.
How to Identify Support and Resistance on Gold Charts (XAU/USD)
Gold has some unique characteristics that affect how support and resistance levels should be identified and used:
Gold prices are heavily influenced by round numbers. The $2,000, $2,500, $3,000 and $3,500 levels have all acted as significant support or resistance in recent years. These psychological round numbers attract enormous institutional order flow and should always be marked on your gold chart.
Gold also tends to form long-term structural levels that hold for years. A resistance level in gold from 2020 may still be relevant in 2026 — far longer than most forex currency pair levels which reset more frequently due to interest rate cycles.
Gold reacts sharply to Federal Reserve announcements, inflation data, and geopolitical events — often gapping through support or resistance levels during these events. These gap moves do not invalidate the levels — price often returns to them later for a test.
Track live XAU/USD gold prices to observe how price interacts with key support and resistance levels in real time at FloatForex.com/gold-charts — updated continuously throughout the trading day.
How to Identify Support and Resistance on Forex Currency Pair Charts
For forex pairs like USD/EUR, USD/GBP, USD/PKR, and USD/JPY, support and resistance identification follows the same principles but with some pair-specific considerations:
For major pairs (USD/EUR, USD/GBP, USD/JPY) — these pairs are heavily traded by institutional participants who watch the same technical levels. Support and resistance levels on major pairs tend to be highly respected because so many large players are aware of them and act on them simultaneously.
For emerging market pairs (USD/PKR, USD/INR) — fundamental factors like IMF policy, central bank reserves, and political developments often override technical levels. Support and resistance still work but may be overridden more frequently by news events than in major pairs.
You can check live rates for all major and emerging market currency pairs at FloatForex.com/currencies to practice identifying current key levels as price is moving in real time.
Common Mistakes to Avoid When Identifying Support and Resistance
Drawing too many levels — the most common beginner mistake is marking every minor price reaction as a level. This results in charts so cluttered with lines that they become useless. Limit yourself to the three to five most significant levels on any chart.
Being too precise with exact price points — support and resistance are zones not exact prices. Price does not reverse at 1.10000 EUR/USD exactly — it reacts within a zone around that level. Think in areas not lines.
Ignoring higher timeframes — a support level on a 15-minute chart means almost nothing if a daily chart shows clear resistance at the same price. Always check what higher timeframes show before acting on lower timeframe levels.
Expecting every level to hold — support and resistance levels fail regularly. No level holds forever. The question is not whether a level will hold but what you will do when it does and what you will do when it does not. Always plan for both scenarios before placing a trade.
Forgetting volume — price reactions at support and resistance carry much more significance when accompanied by above-average trading volume. A bounce off support on high volume is a stronger signal than the same bounce on low volume.
Frequently Asked Questions About Support and Resistance
What is the difference between support and resistance?
Support is a price level below the current market price where buying interest tends to prevent further decline. Resistance is a price level above the current market price where selling pressure tends to prevent further advance. When price breaks through either level the roles typically reverse — old support becomes new resistance and old resistance becomes new support.
How many support and resistance levels should I draw on a chart?
The ideal number of support and resistance levels on any chart is three to five significant levels. More than five levels creates chart clutter that makes decision-making harder not easier. Focus on the most frequently tested and most obvious levels only.
Do support and resistance levels work on gold charts?
Yes. Support and resistance levels work on gold (XAU/USD) charts exactly as they do on forex charts. Round numbers like $2,000, $2,500 and $3,000 per ounce have all acted as significant support or resistance in recent years. You can observe these levels in real time at FloatForex.com/gold-charts.
What timeframe is best for drawing support and resistance?
The daily chart is the best starting point for drawing support and resistance levels. Daily chart levels are watched by the largest number of professional participants and tend to be most reliable. After identifying daily levels you can zoom into lower timeframes to find more precise entry points within those zones.
What happens when price breaks through a support level?
When price breaks convincingly below a support level that support level typically becomes a new resistance level — a concept called role reversal. The broken support area becomes a ceiling where sellers who are now profitable look to add to winning positions while trapped buyers look to exit at breakeven.
Where can I practice identifying support and resistance on live charts?
You can practice identifying support and resistance levels on live real-time charts for gold (XAU/USD) and all major forex currency pairs at FloatForex.com/gold-charts and FloatForex.com/currencies — both completely free with no account required.