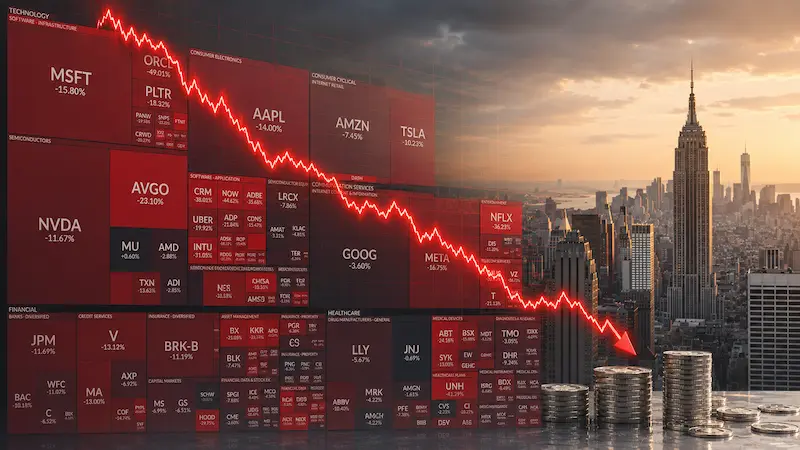

There is a word that economists have been quietly using more and more in 2026 — one that most people alive today have never experienced in their lifetimes and that policymakers genuinely dread. That word is stagflation. It describes an economic condition so rare, so damaging, and so difficult to escape that it defines entire decades in economic history. And in 2026, with an oil shock pushing inflation back up, hiring close to stalling and the Federal Reserve raising interest rates again, serious institutions from Stanford University to RBC Economics are openly discussing whether the United States economy is sliding into exactly this kind of trap.
This article explains precisely what stagflation is, why it is so dangerous, how the current economic data compares to the last major stagflation crisis of the 1970s, and what it means practically for your savings, your currency, and your financial decisions.
What Is Stagflation? — The Direct Definition
Stagflation is an economic condition in which high inflation and high unemployment occur simultaneously, combined with slow or stagnant economic growth. The term is a combination of stagnation and inflation — two forces that normally do not coexist.
In a healthy economy, inflation and unemployment typically move in opposite directions. When the economy grows strongly, businesses hire more workers, unemployment falls, and rising demand pushes prices upward — producing inflation. When the economy slows, demand falls, businesses cut workers, and prices stabilise or decline — reducing inflation. This inverse relationship between inflation and unemployment is known as the Phillips Curve and was the foundation of post-war economic policymaking for decades.
Stagflation breaks this relationship entirely. Prices rise and unemployment rises at the same time, leaving policymakers trapped: the tools used to fight inflation — raising interest rates, tightening monetary policy — worsen unemployment and slow growth further. The tools used to fight recession — cutting rates, stimulating spending — worsen inflation further. There is no clean solution, which is why stagflation episodes are so damaging and so prolonged.
What Causes Stagflation? — The Two Main Triggers
Stagflation is most commonly triggered by supply shocks — sudden disruptions to the supply of essential goods, particularly energy, that simultaneously raise prices and slow economic activity. The mechanism works as follows: when the cost of a fundamental input like oil rises sharply, production costs increase across virtually every industry. Businesses face higher costs, raise prices, and reduce output. Consumers pay more for goods while simultaneously facing job losses as production contracts. Both inflation and unemployment rise together.
In 2026 the supply shock has arrived through both channels. First, sweeping import tariffs raised the cost of a wide range of goods across the American economy. Then the closure of the Strait of Hormuz in late February 2026 disrupted about a fifth of the world's oil supply — what the International Energy Agency called the largest supply disruption in the history of the global oil market. Brent crude peaked near $118 a barrel in March and was still around $109 in early September. By September 2026, US energy prices were 20.4 percent higher than a year earlier. That is the same kind of shock that started the 1970s stagflation.
The second classic cause of stagflation is poor monetary policy — specifically, allowing money supply to grow too fast for too long, creating embedded inflation expectations that persist even as growth slows. The Federal Reserve's extended period of near-zero interest rates following the 2020 pandemic and the subsequent surge in money supply have been cited by numerous economists as contributing factors to the inflation persistence that is making 2026's economic conditions so uncomfortable.
The 1970s Stagflation — What History Teaches Us
The defining stagflation episode of modern economic history occurred in the United States during the 1970s — triggered by the 1973 OPEC oil embargo that quadrupled oil prices in a matter of months. The effects were catastrophic and prolonged.
Between 1973 and 1982 the United States experienced several distinct stagflation waves. At its worst in 1980, the US Misery Index — which adds the inflation rate and unemployment rate together to produce a single measure of economic pain — reached 21.98 percent. Inflation peaked at 14.8 percent. Unemployment reached 10.8 percent. The US economy contracted in multiple quarters. Ordinary Americans watched their purchasing power erode at speeds not seen since the Great Depression. Stock markets lost decades of real value. Interest rates were eventually raised to 20 percent by Federal Reserve Chairman Paul Volcker in a dramatic and painful intervention that broke the inflation cycle but triggered the deepest recession since World War II.
The 1970s stagflation lasted approximately a decade from first shock to resolution — a reminder that once stagflationary dynamics become embedded in wages and prices, they are extraordinarily difficult to dislodge without severe economic pain.
Is the US in Stagflation in 2026? — The Data
The honest answer based on the latest data is: not yet. Inflation is rising again and hiring has nearly stalled, but the economy is still growing at about 2 percent, so the "stagnation" half is not there yet. What has changed since the spring is the cause: an oil shock, the same trigger as the 1970s.
Here is where the key indicators stand as of October 2026 (latest official releases):
| Indicator | Latest Reading | Fed Target / Healthy Level | Assessment |
|---|---|---|---|
| CPI Inflation | 3.7% (Sep) | ~2% | 🔴 Rising again |
| PCE Inflation | 3.4% (Aug) | 2.0% | 🔴 Well above target |
| Core PCE Inflation | 3.0% (Aug) | 2.0% | ⚠️ Above target |
| Energy Prices (CPI) | +20.4% YoY (Sep) | — | 🔴 Oil shock |
| Unemployment (headline) | 4.2% (Sep) | 4.0% or below | ⚠️ Edging up |
| U-6 Unemployment | 7.6% (Sep) | 7.0% (Feb 2020) | ⚠️ Some slack |
| Job Growth (payrolls) | +29,000 (Sep) | — | 🔴 Hiring has nearly stalled |
| Real GDP Growth | 2.2% (Q2, annualised) | ~2% long-run trend | ✅ Holding up |
| Fed Funds Rate | 3.75–4.00% | — | ⚠️ Raised in Sep 2026 |
| Misery Index | 7.9% | Below 5.0% in healthy years | ⚠️ Rising |
Inflation — Inflation has turned back up. Consumer prices rose 3.7 percent in the year to September 2026, up from 3.4 percent in August, and 0.6 percent in September alone. Energy drove most of it: gasoline jumped 9.1 percent in the month, and the energy index is up 20.4 percent on the year. Core CPI, which excludes food and energy, is much lower at 2.6 percent — so this is mainly an energy shock, not yet a broad price spiral. The Fed's preferred PCE measure was 3.4 percent in August, with core PCE at 3.0 percent, both well above the 2 percent target.
Jobs — The labour market is where the "stagnation" half is showing. Employers added just 29,000 jobs in September, and the three-month average is only 51,000. The unemployment rate edged up to 4.2 percent. The broader U-6 rate, which includes discouraged workers and people working part-time who want full-time work, was 7.6 percent. Labour force participation was 61.8 percent, still below the 63.3 percent of February 2020.
GDP growth — Growth is the part that does not fit the stagflation story — yet. Real GDP grew at a 2.2 percent annual rate in the second quarter of 2026, and the first quarter was revised up to 2.5 percent. Consumer spending, business investment and exports have held up. But growth is slowing from quarter to quarter, and with hiring this weak, it may not stay near trend for long.
The Fed is raising rates again — On 16 September 2026 the Federal Reserve raised interest rates by 0.25 percentage points to 3.75–4.00 percent, its first hike since 2023, saying inflation "remains elevated". Most officials expect rates to end 2026 between about 4.1 and 4.4 percent, which points to one more hike.
The Misery Index — Adding CPI inflation (3.7 percent) and unemployment (4.2 percent) gives a Misery Index of 7.9 percent. That is far below the 1970s, but above the readings of under 5 percent seen in much of the 2010s, and it is rising.
Why Stagflation Is So Difficult for the Federal Reserve to Fight
The Federal Reserve's dilemma in a stagflationary environment is genuinely difficult — and understanding it helps explain why central banks are so cautious about stagflation scenarios.
The Fed has two mandates: price stability — keeping inflation near 2 percent — and maximum employment. In normal economic conditions these mandates are complementary. In a stagflationary environment they directly conflict.
If the Fed raises interest rates aggressively to bring inflation down — as Volcker did in 1980 — higher borrowing costs reduce consumer spending and business investment, slow economic growth, and increase unemployment. In 2026, with hiring already close to stalling, aggressive tightening risks tipping the labour market into outright job losses.
If the Fed cuts interest rates to stimulate growth and reduce unemployment, cheaper money encourages borrowing and spending, increasing demand in an economy where prices are already rising too fast. Cutting rates during a period of above-target inflation risks entrenching higher prices and damaging the Fed's credibility as an inflation fighter — a credibility that took decades to build and is essential to keeping long-term inflation expectations anchored.
Stanford's SIEPR describes this as the core challenge: aggressive moves in response to spiking inflation can drive up unemployment and stifle economic growth, while lowering rates to boost economic growth risks driving up prices. The stagflation risk is real.
In September 2026 the Fed made its choice: it raised rates to 3.75–4.00 percent, its first hike since 2023, even though employers added only 29,000 jobs that month. In other words, it put inflation first. That is the stagflation dilemma in action — and if the oil shock keeps pushing prices up while hiring weakens further, the Fed's next decisions will only get harder.
How Stagflation Affects Currency Exchange Rates
Stagflation has significant and complex effects on currency exchange rates — effects that are directly relevant to anyone converting currency, sending international transfers, or tracking rates for the dollar against euros, pounds, Pakistani rupees, or other currencies.
In the early stages of stagflation, the domestic currency often weakens. Slowing growth reduces foreign investment interest in the country. Higher inflation erodes the real purchasing power of the currency. If inflation is running higher domestically than in trading partner countries, imports become relatively cheaper and exports relatively more expensive, weakening the trade balance and putting pressure on the exchange rate.
However, the relationship becomes more complicated when the central bank responds with rate hikes. Higher interest rates attract foreign capital seeking better returns, which can temporarily strengthen the currency even as the underlying economy weakens. This is why stagflation-era currency movements are often volatile and difficult to predict — the inflation and the policy response can pull the exchange rate in different directions simultaneously.
For anyone monitoring the dollar against major currency pairs — whether tracking USD to EUR, USD to GBP, or emerging market pairs like USD to PKR and USD to INR — stagflation environments require closer attention to central bank communications than in normal conditions. Small shifts in Fed language about the rate path can produce immediate and significant exchange rate moves. You can track all live currency exchange rates at FloatForex's live currency rates page — updated in real time throughout the trading day.
How Does Gold Perform During Stagflation?
Gold has a well-documented historical relationship with stagflation — and it is one of the most important relationships in financial markets for understanding asset behaviour during the current economic environment.
During the 1970s stagflation episode, gold delivered extraordinary returns. When the US dollar was decoupled from gold in 1971 and stagflationary pressures built through the decade, gold rose from $35 per ounce to $850 per ounce by January 1980 — a gain of more than 2,300 percent over nine years. In real purchasing power terms, gold preserved and dramatically grew wealth during the most severe peacetime economic crisis in post-war American history.
The reasons gold performs well during stagflation are structural. Inflation erodes the value of cash and bonds — assets that pay fixed nominal returns that fall in real value as prices rise. Gold, being a physical asset with no counterparty risk and a supply that cannot be inflated away, preserves purchasing power when paper currencies are being eroded. The uncertainty and institutional distrust that typically accompany stagflationary periods also drive safe haven demand for gold from investors seeking assets that do not depend on any institution's promise or performance.
In the current 2026 environment, gold has been performing strongly as stagflation concerns mount — reflecting exactly this dynamic. For a complete analysis of where gold is heading next, see our detailed Gold Price Forecast 2026 — Will XAU/USD Hit $5,000, $6,000 or Higher? guide. Track live XAU/USD gold prices in real time at FloatForex's gold charts to monitor how gold is responding to evolving stagflation signals.
What Stagflation Means Practically for Your Money in 2026
Understanding stagflation theoretically is useful. Understanding what it means for real financial decisions is essential. Here is what the current stagflation risk environment means practically:
Your savings are losing real value. When inflation runs at 3.4 to 3.7 percent and savings account rates in many banks fail to match that level, every month of inaction costs real purchasing power. The compound effect of inflation on savings over five or ten years is significant — you can calculate exactly how inflation erodes the real value of your savings using the compound interest calculator at FloatForex.
Fixed income investments face real return risk. Bonds and fixed deposits that were locked in at rates before the current inflation episode are delivering negative real returns — the nominal interest payment does not cover the purchasing power lost to inflation. This is one of the most direct financial effects of stagflation on ordinary savers and retirees who rely on fixed income.
Exchange rates become more volatile and less predictable. As the Fed navigates between inflation control and growth support, every data release and every Fed statement becomes a potential trigger for significant exchange rate movement. Anyone converting dollars to foreign currencies for remittances, travel, or business payments faces more rate volatility than in stable economic conditions. Checking live rates immediately before any conversion — available at FloatForex's currencies page — is more important than ever when rates are moving rapidly.
Portfolio diversification toward real assets becomes more relevant. Historically, stagflation environments have favoured assets with intrinsic value — gold, commodities, and real estate — over financial assets with fixed nominal returns. For practical inflation hedging strategies, see our companion guide: How to Protect Your Money From Inflation — The 5 Best Inflation Hedges That Actually Work. This does not constitute investment advice, but understanding the historical pattern helps explain why gold has attracted increasing attention as stagflation concerns have grown through 2026.
Is 2026 Really as Bad as the 1970s? — A Side-by-Side Comparison
The honest answer is: not yet, and possibly not at all — but the risk deserves serious attention.
| Indicator | 1980 (Worst of 1970s Stagflation) | 2026 (Latest) |
|---|---|---|
| Inflation (CPI) | 14.8% (peak) | 3.7% (Sep 2026) |
| Unemployment | 10.8% (peak, 1982) | 4.2% (Sep 2026) |
| Misery Index | 21.98% (peak) | 7.9% |
| Fed funds rate | 20% (Volcker) | 3.75–4.00% (raised Sep 2026) |
| Trigger | 1973 OPEC oil embargo; 1979 oil shock | Strait of Hormuz closure (oil shock), plus import tariffs |
| Fed inflation-fighting credibility | Low — being rebuilt | High — post-Volcker era |
| Long-term inflation expectations | Unanchored | Anchored but under pressure |
| Economy's oil dependence | Severe | Lower, but energy prices are up 20% in a year |
Inflation at 3.7 percent is nowhere near the 14.8 percent peak of the 1970s stagflation era, and unemployment at 4.2 percent is far below the double-digit levels of that period. The current Misery Index of 7.9 percent is a fraction of the 1980 peak.
The key differences between 2026 and the 1970s are important. The Federal Reserve has significantly more institutional credibility as an inflation fighter than it did in the 1970s — credibility built by the painful Volcker disinflation of the early 1980s. Long-term inflation expectations, while rising, remain considerably better anchored than they were when stagflation became fully entrenched five decades ago. The US economy is also more diversified and less oil-dependent than in 1973, reducing the direct impact of any single commodity shock.
What 2026 shares with the 1970s is the structural challenge: a supply shock (then an oil embargo, now the Strait of Hormuz closure on top of tariffs) raising prices while simultaneously weighing on growth, a central bank with conflicting mandates pulled in different directions, and an erosion of consumer confidence as households feel squeezed by rising costs against stagnating real wages. Whether 2026's stagflation lite evolves into something more severe depends primarily on how long the oil shock lasts, how far the Fed raises rates, and whether the labour market stabilises or starts shedding jobs.
Frequently Asked Questions — Stagflation 2026
What is stagflation in simple terms?
Stagflation is when a country's economy experiences high inflation and high unemployment at the same time, combined with slow economic growth. It is rare because inflation and unemployment normally move in opposite directions. Stagflation is particularly difficult to fix because the policy tools used to fight inflation tend to make unemployment worse, and vice versa.
What causes stagflation?
Stagflation is most commonly caused by supply shocks — sudden disruptions that raise production costs across the economy, such as oil price spikes or widespread import tariffs. When production costs rise sharply, businesses raise prices and reduce output simultaneously, creating both inflation and unemployment at the same time.
Is the US in stagflation in 2026?
Not yet. Inflation has risen to 3.7 percent (September 2026) because of an oil shock, and hiring has nearly stalled, but unemployment is still 4.2 percent and the economy grew at a 2.2 percent annual rate in the second quarter. Both inflation and unemployment are far below the extreme levels of the 1970s. The risk has grown since the spring, however: the Federal Reserve raised interest rates in September to fight inflation even as job growth slowed.
What was the worst stagflation in US history?
The worst US stagflation occurred in 1980 when the Misery Index — inflation plus unemployment — reached 21.98 percent. Inflation peaked at 14.8 percent and unemployment reached 10.8 percent following the second oil shock. It took Federal Reserve Chairman Paul Volcker raising interest rates to 20 percent and triggering a severe recession to finally break the inflation cycle.
Does gold do well during stagflation?
Historically yes. During the 1970s US stagflation, gold rose from $35 per ounce to $850 per ounce — a gain of more than 2,300 percent over nine years. Gold performs well during stagflation because it preserves purchasing power when inflation erodes cash values, and because uncertainty drives safe haven demand for assets with no counterparty risk. Track live gold prices at FloatForex's gold charts.
How does stagflation affect exchange rates?
Stagflation creates complex and often volatile exchange rate movements. Slowing growth and above-target inflation can weaken the domestic currency, but central bank rate hikes in response to inflation can attract foreign capital and temporarily strengthen it. The net effect depends on how aggressive monetary policy becomes relative to other countries. Track live USD exchange rates against all major currencies at FloatForex's currencies page.
What is the Misery Index?
The Misery Index is an economic indicator calculated by adding the current inflation rate and the unemployment rate together. It was developed by economist Arthur Okun as a simple measure of economic pain felt by ordinary citizens. A higher Misery Index indicates worse economic conditions for households. The US Misery Index stood at about 7.9 percent in September 2026 (3.7 percent inflation plus 4.2 percent unemployment) — rising, but well below the 21.98 percent peak of 1980.
What is the difference between stagflation and recession?
A recession is defined by falling economic output and rising unemployment — but with falling or stable inflation as demand drops. Stagflation combines the worst of both worlds: stagnant or contracting growth and rising unemployment, but with inflation continuing to rise rather than fall. This makes stagflation more damaging than a typical recession because consumers face job losses and rising prices simultaneously, with no relief from declining costs.
What should I do with my money during stagflation?
This article is for educational purposes and does not constitute financial advice. Historically, stagflation has been associated with strong performance in real assets like gold and commodities, negative real returns on fixed income, and complex currency dynamics. For specific inflation-hedging strategies, see our guide on how to protect your money from inflation. Use the free compound interest calculator to model how inflation affects the real value of savings over time.
Conclusion — Not Stagflation Yet, but the Risk Has Grown
The US economy in 2026 is not in 1970s-style full stagflation. Inflation at 3.7 percent and unemployment at 4.2 percent are uncomfortable but nowhere near the catastrophic 14.8 percent inflation and 10.8 percent unemployment of 1980. The Federal Reserve has the institutional credibility, and long-term inflation expectations remain better anchored than they did when the last stagflation crisis took hold.
But the warning signs are stronger than they were in the spring. An oil shock — the classic stagflation trigger — has pushed energy prices up 20 percent in a year. Inflation is rising again. Employers added only 29,000 jobs in September. And the Federal Reserve has started raising rates even as hiring weakens. The one piece still missing is a real slowdown in growth.
Whether stagflation lite evolves into something more severe depends on the choices the Federal Reserve makes over the next 12 months, how long oil prices stay high, and whether the labour market stabilises or continues to weaken. For now, understanding what stagflation is, how it played out historically, and what it means for currencies, gold, and savings is the foundation of making informed financial decisions in an unusually uncertain environment.
Related FloatForex guides:
Gold Price Forecast 2026 — XAU/USD Targets |
How to Protect Your Money From Inflation |
Is a Recession Coming? 7 Warning Signs |
What Are Tariffs and How Do They Cause Inflation? |
Live Gold Price — XAU/USD Chart |
All Live Currency Rates — 150+ Pairs
Sources
- US Bureau of Labor Statistics — Employment Situation, September 2026
- Advisor Perspectives — CPI inflation at 3.7% in September 2026 (BLS data)
- US Bureau of Economic Analysis — GDP, second quarter 2026 (third estimate)
- Tech Times — August 2026 PCE inflation 3.4%, core 3.0%
- Federal Reserve — FOMC statement, 16 September 2026
- 2026 Iran war fuel crisis — overview of the Strait of Hormuz oil shock
Data last updated: October 2026. Note: This article is for educational purposes only and does not constitute financial or investment advice. Economic conditions and forecasts evolve rapidly. Always consult a qualified financial advisor before making investment or financial planning decisions.